Backtest report charts explained
The Report tab of a backtest has charts that show how the result came about: when the EA traded, how long, and how far trades went in your favour or against you before they closed.
In short:
- Balance: the balance, equity and lot size over time, with the deposit load.
- Entries and results: when positions opened, and when profits and losses were made.
- Position holding time: how long each position was open, against its profit.
- MFE and MAE: how far each position went into profit and into loss while it was open.
Balance, equity and lot size
Section titled “Balance, equity and lot size”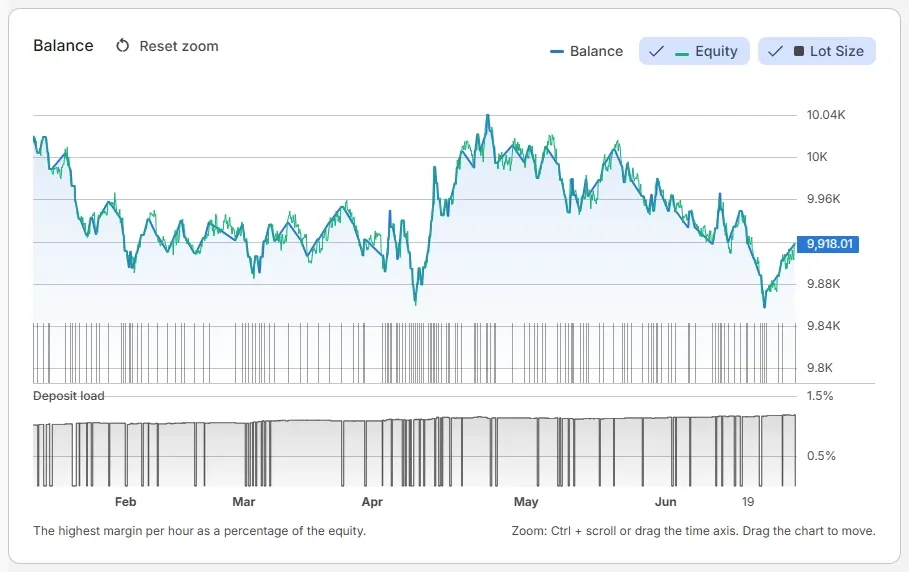
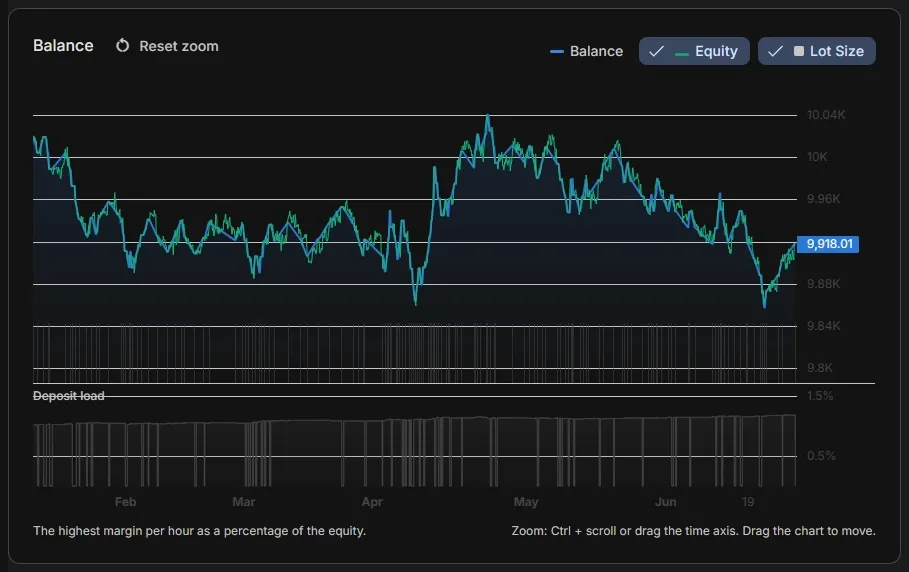
- Balance: the account balance after each closed trade.
- Equity: the balance plus the floating profit or loss of open positions. A big gap between equity and balance means positions went deep into loss before they closed.
- Lot Size: the volume of each position, as bars. Useful to check your money manager.
Click Equity or Lot Size to show or hide them.
Zoom: Ctrl + scroll, or drag the time axis. Drag the chart to move it; Reset zoom shows the full period again.
Deposit load
Section titled “Deposit load”The pane under the balance: the highest margin per hour as a percentage of the equity. High peaks mean the EA used a lot of your margin at once, for example with many open positions or large lot sizes.
Entries and results per hour, weekday and month
Section titled “Entries and results per hour, weekday and month”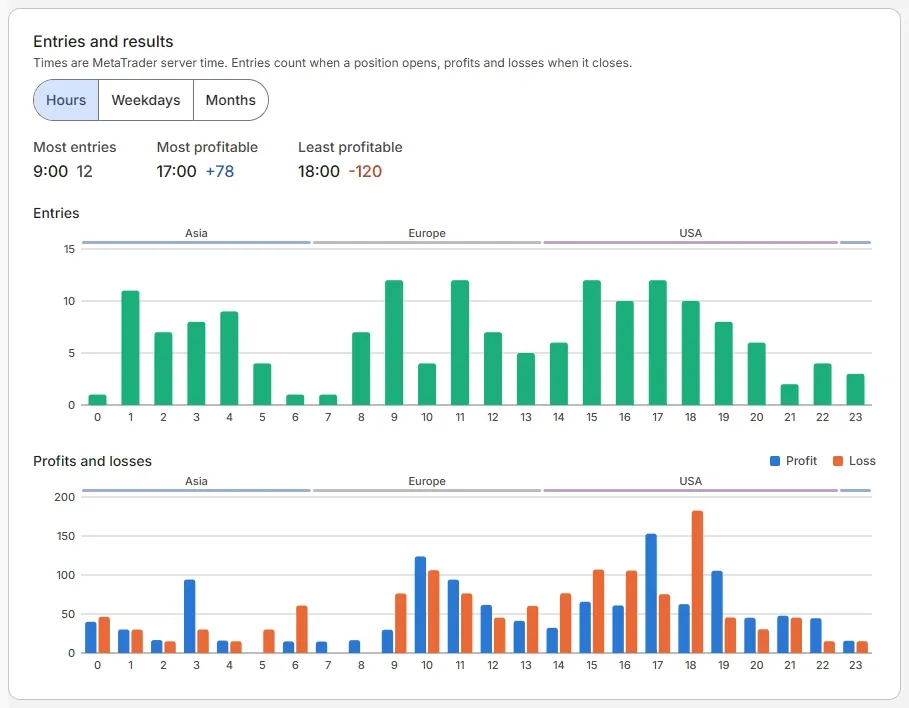
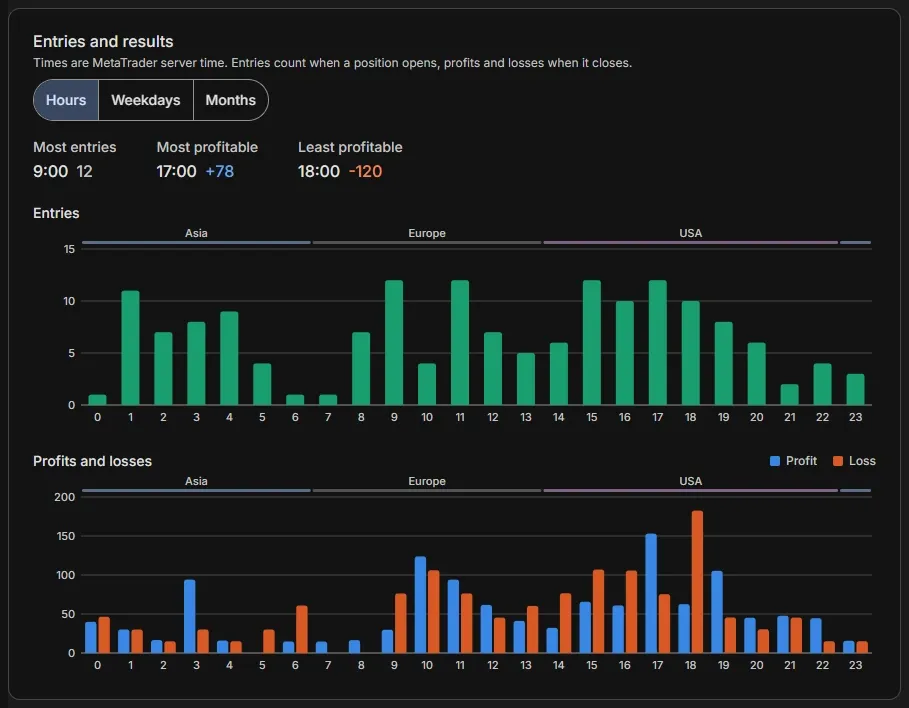
- Choose Hours, Weekdays or Months.
- Most entries, Most profitable and Least profitable sum up the chart.
- Entries: how many positions opened in each hour, weekday or month.
- Profits and losses: the profit and the loss of the positions that closed then.
- With Hours, the bands show the Asia, Europe and USA trading sessions.
Times are MetaTrader server time. Entries count when a position opens, profits and losses when it closes.
How to use it: hours or days that lose consistently are candidates for a Trading session exclusion. Check it on another period first: a pattern in one backtest can be chance.
Position holding time
Section titled “Position holding time”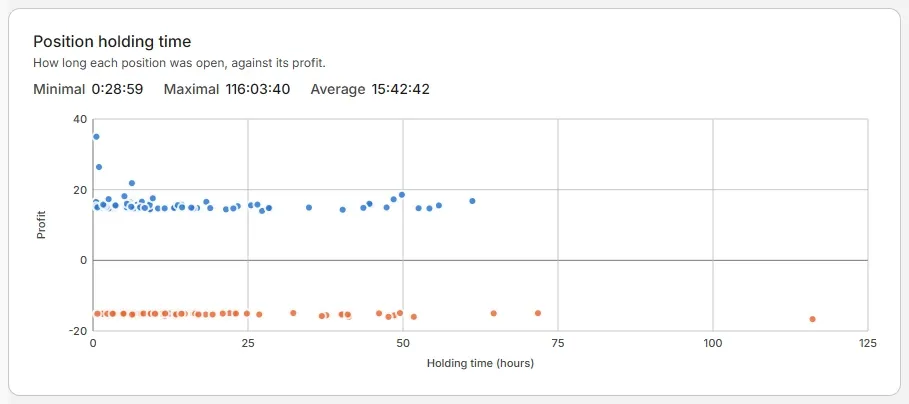
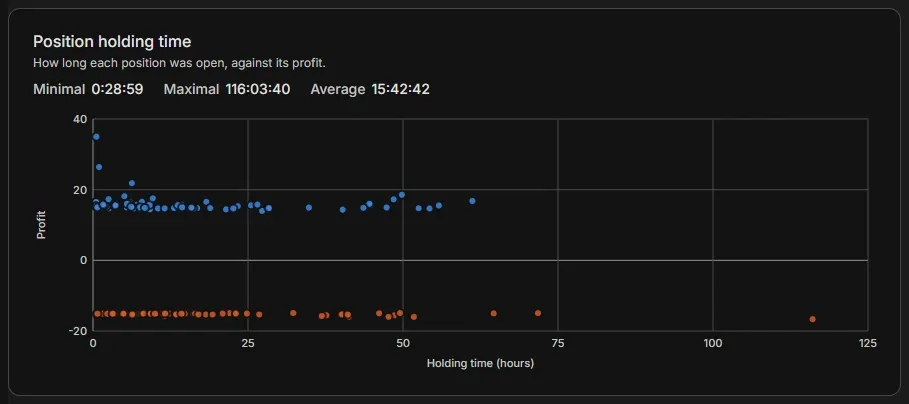
- Minimal, Maximal and Average: the shortest, longest and average time a position was open.
- Each dot is a position: its holding time (hours) against its profit.
How to read it: if the losing positions are open much longer than the winning ones, the EA lets losses run. A Maximum lifespan or a tighter stop loss can help.
MFE and MAE
Section titled “MFE and MAE”Two charts with one dot per position, against its final profit:
- MFE (Maximum Favorable Excursion): the largest floating profit of each position while it was open.
- MAE (Maximum Adverse Excursion): the largest floating loss of each position while it was open.
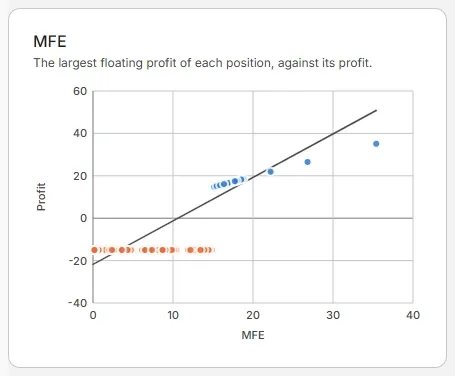
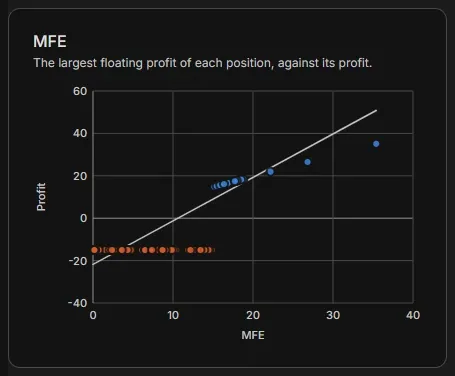
How to read MFE: dots on the diagonal kept all the profit they reached. Losing positions far to the right were in profit first and then turned into a loss: a trailing stop loss or a take profit could have kept part of it.
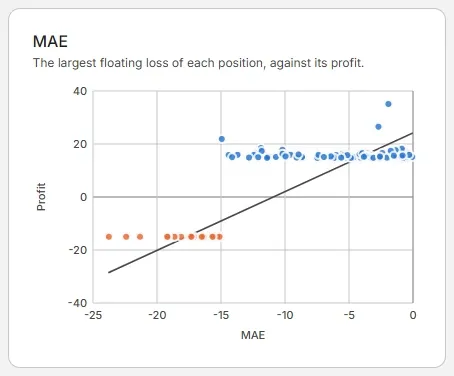
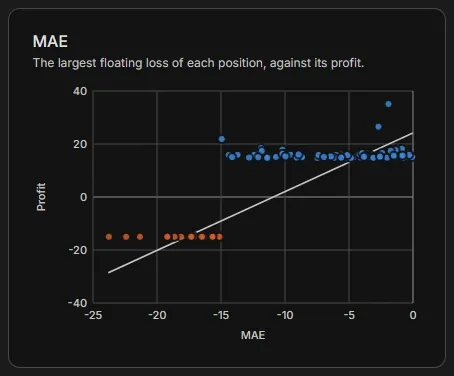
How to read MAE: winning positions that first went deep into loss need a wide stop loss to survive. If most winners never went further than a certain loss, a stop loss just beyond it cuts the losers early without hurting the winners.
The correlation between profit and MFE / MAE is in the statistics: see Read your backtest results.
Related
Section titled “Related”- Read your backtest results: the key figures and statistics
- How to analyse a backtest: a step-by-step check
- Orders and deals: every position in detail
MetaTrader is a registered trademark of MetaQuotes Ltd. EA Builder Pro is not affiliated with MetaQuotes.