Read your backtest results
When a backtest has finished, open it from the Backtest list to see the result. The result page has four tabs:
- Overview: the outcome at a glance: start balance, end balance, max drawdown, profit or loss, and the settings of the test.
- Report: key figures, charts and the full MetaTrader Strategy Tester statistics.
- Orders: every order your EA placed. See Orders and deals.
- Deals: every deal (execution) of your EA. MT5 only. See Orders and deals.
With the arrows at the top you browse to the previous or next backtest in your list, so you can compare results quickly.
Overview
Section titled “Overview”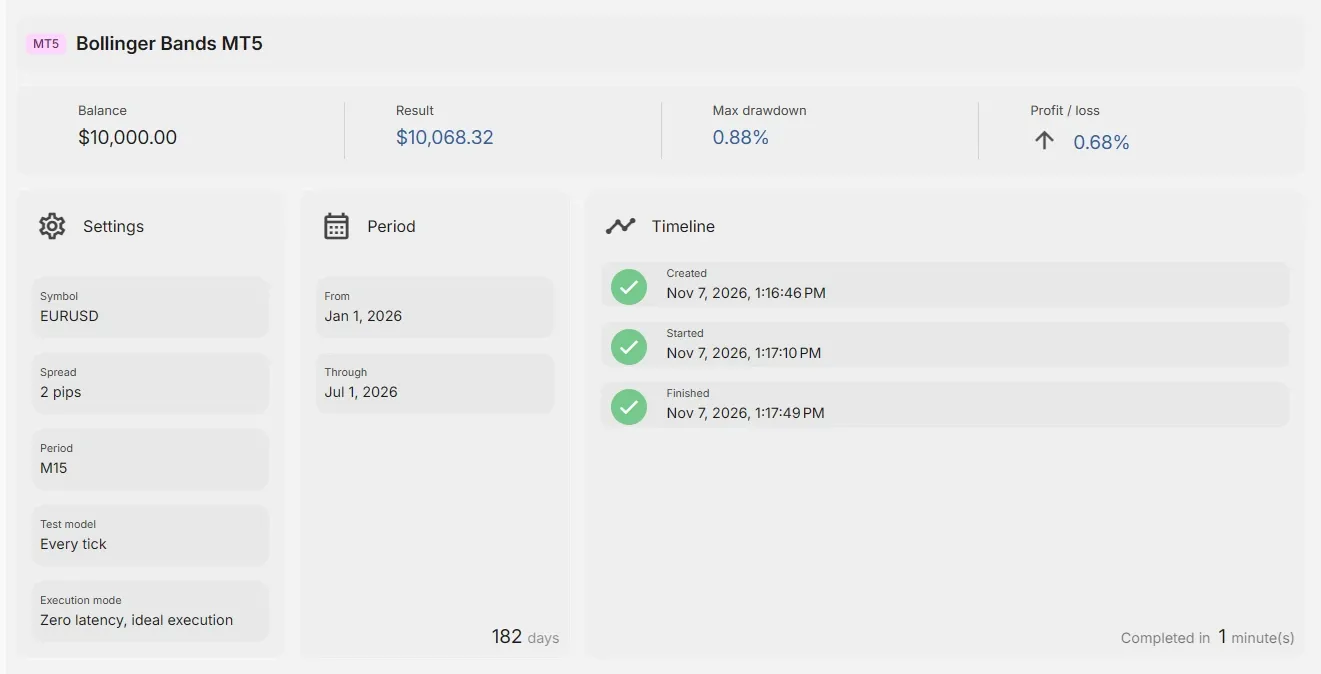
Result
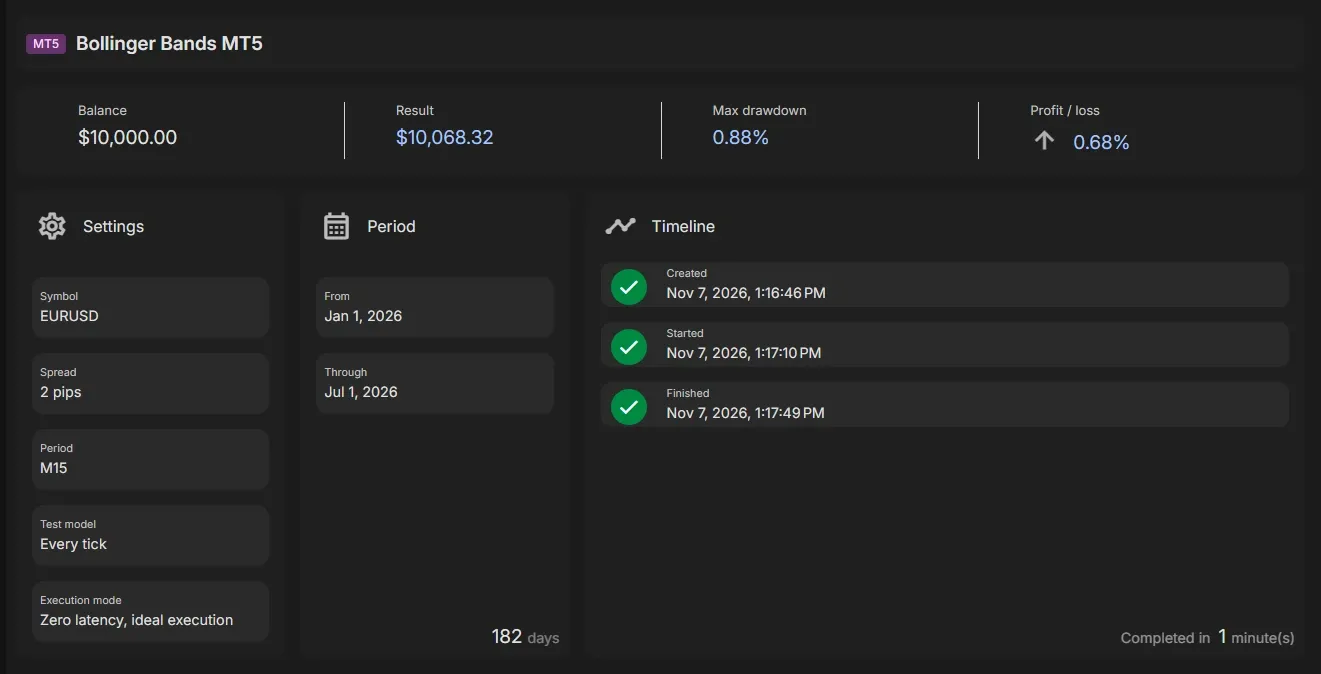
Section titled “Result”- Balance: the deposit the backtest started with.
- Result: the balance at the end of the backtest. Open positions are closed at the end of the test, so their profit or loss is included.
- Max drawdown: the largest drop from a peak, as a percentage, including open trades (the equity drawdown of the report). This is the worst loss you would have had to sit through. See Drawdown below.
- Profit / loss: the result compared to the start balance. A start balance of 10,000 and a result of 12,500 is +25%.
Settings and period
Section titled “Settings and period”The settings show the conditions of the test: Symbol, Spread, Period (timeframe), Test model and, for MT5, the Execution mode. The period shows the first and the last day tested and the number of days. Always check these before you compare two backtests: a different spread or test model can change the result a lot.
Timeline
Section titled “Timeline”When the backtest was created, started and finished, and how long it took.
Status messages
Section titled “Status messages”Sometimes a backtest stops before the end of the period. A message above the result tells you why.
| Message | What it means | What to do |
|---|---|---|
| The trader hasn’t traded for 90 days in a row | No order was opened for 90 days. | Check the conditions of your Open Buy and Open Sell signals. They are probably never true. |
| The trader took more than 10 minutes to backtest just 1 month | The EA is too slow for the chosen test model, usually because of a heavy custom indicator. | Choose a faster test model, such as “Open prices only” or “1 minute OHLC”. |
| We stopped the trader, because it has lost 25% within 30 days | The account lost a quarter of its value in a month. | Review your stop loss and money management. |
| We stopped the trader, because it has lost 75% within 180 days | The account lost three quarters of its value within half a year. | Review your stop loss and money management. |
| Not enough margin to open (more) orders | The free margin was too low for the next order. | Lower the lot size, or limit the number of open orders. |
| Slow indicator(s). The backtest couldn’t finish within 2 hours | The backtest hit the time limit. | Choose a faster test model or a shorter period. |
| No quotes found | There was no tick data in the period, for example a weekend or a holiday. | Choose a longer period. |
| The custom indicator could not be compiled | The uploaded source of a custom indicator has errors. | Fix the indicator in MetaEditor and upload it again. |
When the trader was stopped, the backtest still has a result: everything up to the moment it was stopped.
Report
Section titled “Report”The Report tab shows the result in three parts: the key figures, charts, and the statistics of the MetaTrader Strategy Tester report, the same report you get when you test in MetaTrader yourself. You can also download it.
Key figures
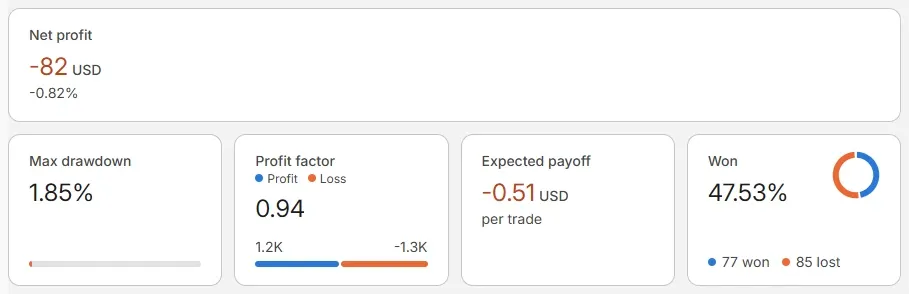
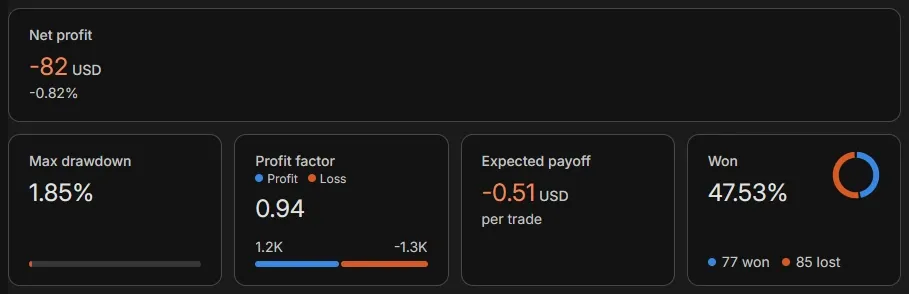
Section titled “Key figures”The tiles at the top show the numbers that matter most:
- Net profit: the profit or loss in the account currency, and in % of the starting balance.
- Max drawdown: the largest drop from a peak, in %. See Drawdown.
- Profit factor: gross profit divided by gross loss, with both shown under it. See Profit.
- Expected payoff: the average result per trade.
- Won: the share of winning trades, with the number of won and lost trades.
Charts
Section titled “Charts”Under the key figures: the balance, equity and lot size over time, the deposit load, entries and results per hour, weekday and month, the position holding time, and MFE and MAE. How to read them: Backtest report charts.
Statistics
Section titled “Statistics”The statistics of the MetaTrader report, in groups. These are the numbers that matter most.
Profit
Section titled “Profit”- Total net profit: gross profit plus gross loss. This is the bottom line.
- Gross profit: the sum of all winning trades.
- Gross loss: the sum of all losing trades.
- Profit factor: gross profit divided by gross loss (as a positive number). A profit factor of 1.5 means that for every 1 dollar lost, 1.5 dollars was won. Below 1 the strategy loses money.
- Expected payoff: the average result per trade (total net profit divided by the number of trades). This is what one trade earns on average. Compare it with your spread and commission: if it is only slightly higher, small differences in costs can turn the result negative.
- Recovery factor: total net profit divided by the maximal drawdown. A recovery factor of 3 means the strategy earned three times its worst drop.
- Sharpe ratio (MT5): the return compared to how much the results vary. The higher, the steadier the growth.
What is a good profit factor?
Section titled “What is a good profit factor?”There is no fixed limit, but as a rule of thumb: below 1 loses money, 1 to 1.3 is fragile (costs and slippage can wipe it out), 1.3 to 2 is solid, and much higher than 3 is often too good to be true. Check then whether there are enough trades and whether the strategy is not tuned to this one period (see Analyse a backtest).
Drawdown
Section titled “Drawdown”A drawdown is a drop from a peak to a later low. MetaTrader shows it in three ways:
- Absolute drawdown: how far the balance fell below the start balance. If the balance never went below the deposit, this is 0.
- Maximal drawdown: the largest drop from any peak to the following low, in money and as a percentage of that peak.
- Relative drawdown: the largest drop as a percentage. It is usually the same drop as the maximal drawdown, but not always: a drop of 1,000 from 20,000 (5%) is larger in money than a drop of 600 from 5,000 (12%), but smaller as a percentage.
MT5 shows each drawdown twice: for the balance (closed trades only) and for the equity (including the floating profit or loss of open positions). The equity drawdown is the honest one: if a trade was 30% in loss before it turned into profit, you only see that in the equity drawdown.
Trades
Section titled “Trades”- Total trades: the number of closed trades. MT5 also shows Total deals; each trade normally has an opening and a closing deal, so 87 trades give 174 deals.
- Short trades (won %) and Long trades (won %) (MT4: Short positions and Long positions): the number of sell and buy trades and how many of them were profitable. A big difference between the two shows the strategy works in one direction only.
- Profit trades and Loss trades (% of total): the win rate. A low win rate is fine when the winners are much bigger than the losers, and the other way around.
- Largest profit trade and Largest loss trade: the best and the worst single trade.
- Average profit trade and Average loss trade: the average size of a winner and of a loser. Together with the win rate this tells you whether the strategy has an edge.
- Maximum consecutive wins / losses: the longest winning and losing streak, with the money won or lost in it. Important for money management: a martingale or a high risk per trade can not survive a long losing streak.
- Average consecutive wins / losses: the average length of a streak.
Only in MT4
Section titled “Only in MT4”- Bars in test, Ticks modelled and Modelling quality: how much data was used. A low modelling quality means the result is less reliable.
- Mismatched charts errors: gaps in the data.
Only in MT5
Section titled “Only in MT5”- History quality: the share of real tick data in the test. 100% is best.
- AHPR / GHPR: the average (arithmetic and geometric) return per trade.
- LR correlation: how close the balance curve is to a straight line. Close to 1 means steady growth.
- Z-score: whether wins and losses come in streaks. Above 2 or below -2 means they do.
- Margin level: the lowest margin level during the test.
- Minimal / Maximal / Average position holding time: how long positions were open.
- Correlation (Profits, MFE / MAE): how the result of a trade relates to its largest floating profit (MFE) and largest floating loss (MAE) while it was open. A high correlation with MFE means trades keep most of the profit they reach.
Inputs
Section titled “Inputs”The inputs of the EA in this backtest, as MetaTrader shows them: the values of your modules, money manager and constants with an Input Name.
Next steps
Section titled “Next steps”- Orders and deals: what each row and column in the Orders and Deals tabs means.
- Analyse a backtest: a step-by-step way to judge a result.
- Run a backtest: how to start a backtest or recover the EA.
- Your backtests: find, filter, download or delete a backtest.
MetaTrader is a registered trademark of MetaQuotes Ltd. EA Builder Pro is not affiliated with MetaQuotes.